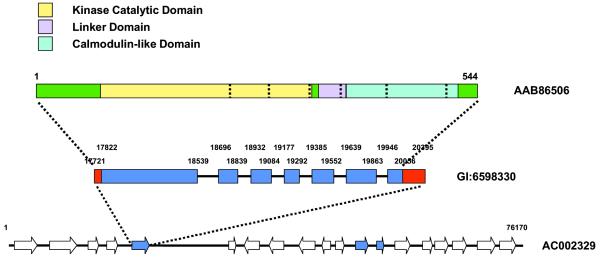
Figure 2.
Graphical display of sequence features. AAB86506 represents a protein sequence with functional regions shown in color and intron/exon boundaries shown as dotted lines. GI:6598330 represents a primary transcript with untranslated regions (red), exons (blue) and introns (black). AC002329 show genes in the region of the coding sequence with unknown genes (white), known genes (hatched) and other kinase or phosphatase genes (blue).

