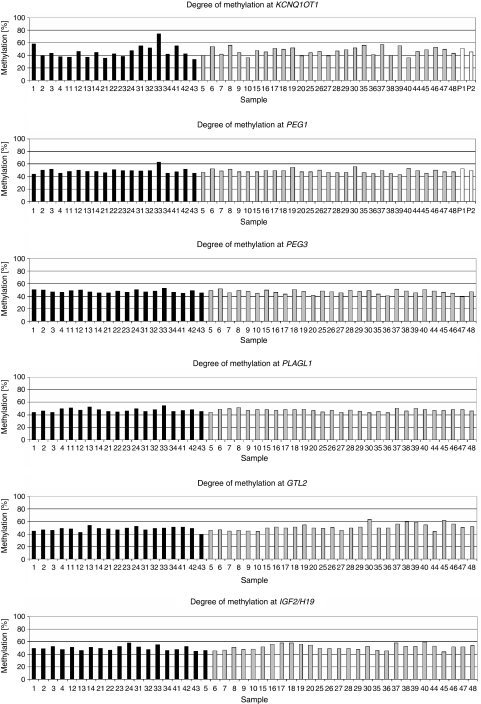
Figure 1.
Methylation analysis by sequence-based quantitative methylation analysis (SeQMA). The histograms show the degree of methylation at six loci in intracytoplasmic sperm injection (ICSI)/small for gestational age (SGA) children (black bars), control children (gray bars) and the parents of child no. 33 (P1 and P2, white bars; KCNQ1OT1 and PEG1 only). Child no. 33 is hypermethylated at KCNQ1OT1 and possibly at PEG1. Her parents have normal methylation levels. Because of insufficient material of sample no. 11, we could not perform SeQMA for the locus IGF2/H19 for this sample.

