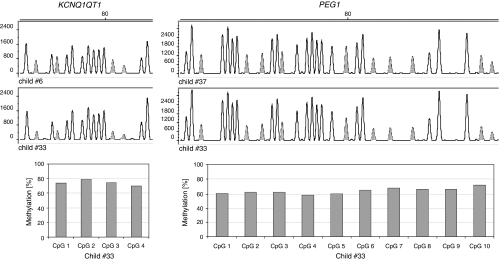
Figure 2.
Single-site methylation analysis. Sequencing reactions were subjected to GeneScan analysis. The upper four panels show the T channel outputs for KCNQ1OT1 (left) and PEG1 (right). Thymine residues resulting from bisulfite conversion of CpGs to TpGs are indicated in gray. Compared to children of the control group, child no. 33 is hypermethylated at the KCNQ1OT1 CpGs and borderline hypermethylated at the PEG1 CpGs.

