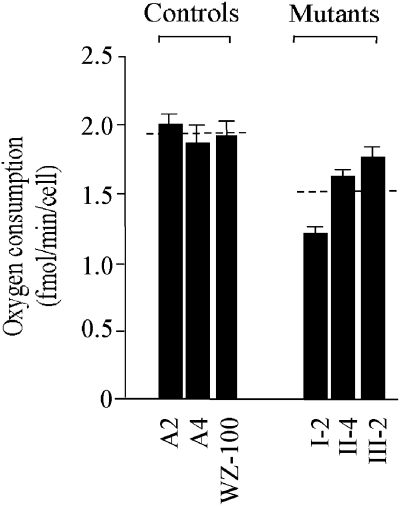
Figure 5.
Respiration assays. Average rates of endogenous oxygen consumption per cell measured in different lymphoblastoid cell lines are shown, with error bars representing standard errors of the mean (SEM). The six determinations were carried out for each cell line. The horizontal dashed lines represent the average value for each group.

