Figure 1.
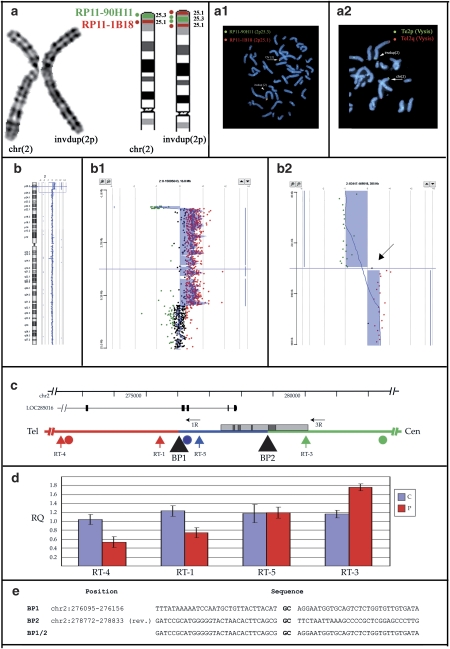
Overview of molecular data from Case 2. Identical results were obtained on Case 1 and Case 3. (a) Cytogenetics and FISH results. (from left) cut-out of the normal and abnormal chromosomes 2 in G-banding at a resolution of 550 bands. Ideogram of normal and inverted duplicated chromosomes 2p: th 2p25.3 and 2p25.1 bands are depicted in green and red, respectively. The dots represent BAC clones RP11-90H11 (2p25.3, green dot) and RP11-1B18 (2p25.1, red dot). Double-colour FISH with BACs RP11-90H11 (green signal) and RP11-1B18 (red signal): the normal chromosome 2 (arrow) has two signals. The order of red and green signals in the dup(2) (arrowhead) demonstrates that the duplication is inverted (a.1). FISH with subtelomeric 2p probe (green signal) and 2q (red signal) (Vysis) showed hybridization signals on both normal (arrow) and invdup (arrowhed) chromosome 2 (a.2). (b) Array-CGH (aCGH) analysis. aCGH profile of chromosome 2 showing the deletion/duplication at 2p25.3–25.1. Enlargement of the deleted and duplicated regions (b.2). On the right, detailed view of deletion/duplication boundary. The arrow points to a single probe with a log ratio of +0.2 located between the deleted and duplicated regions (b.3). (c) Detail of the breakpoint region on chromosome 2p. The deletion is shown in red, the duplication in green, the single-copy region in blue. The locations of the breakpoints (black triangles), aCGH (circles) and real-time (vertical arrows) probes, and long-range PCR primers (horizontal arrows) are indicated. The positions of the LOC285016 gene and of a CpG island (gray box) containing several repetitive elements (dark gray boxes) are also shown. (d) Real-time PCR results. Average Relative Quantification (RQ) by real-time PCR of Cases 1–3 (P) and three normal controls (c). (e) Sequence of the breakpoints. The CG dinucleotide representing the only homology between the two breakpoints is highlighted in bold.

