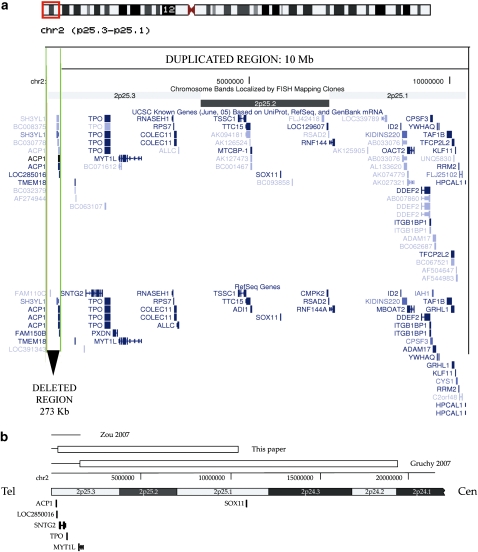
Figure 2.
(a) Schematic representation of the deleted/duplicated region in our patients. Screenshot obtained from http://genome.ucsc.edu, UCSC Genome Browser on Human May 2004 Assembly. The upper part of the figure shows the idiogram of chromosome 2, in which the aberrant region is indicated by a grey square*. The deletion of 273 kb is indicated by the two vertical grey lines** and pointed by a black arrowhead. The duplicated region of 10 Mb is shown by a black square. (b) Structure of the rearrangement and comparison with other recently described 2p rearrangements. Deleted regions are indicated by lines, duplicated regions by boxes. *Red square in the html version, **green lines in the html version.

