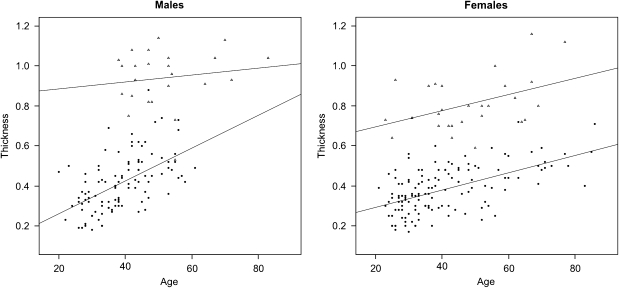
Figure 1.
Regression analysis of epidermal thickness in a series of normal controls and 35delG GJB2 carriers. P-values have been obtained using a regression analysis of epidermal thickness using status, age and sex as covariates. Statistical analysis and graphs have been carried out using R software version 2.7.0. Triangles: carriers; Black dots: normal controls. Measurements of epidermal thickness have been obtained using a ultrasound linear large band probe ranging from 6 to 15 MHz with the probe placed at the midline of the forehead.

