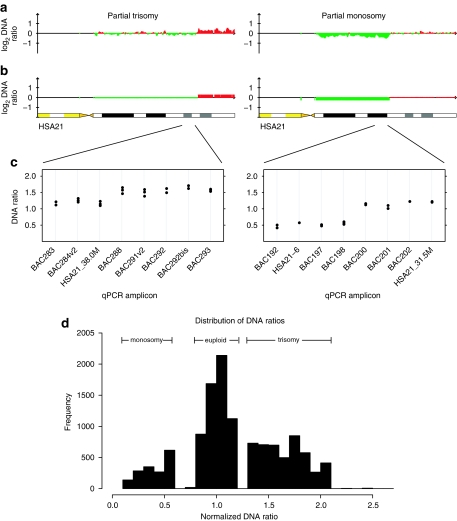
Figure 1.
Examples of HSA21 array CGH results. (a) Plots of DNA ratio for two cases. X-axis, position along HSA21; Y-axis, normalized log2 ratio of case/control signal. (b) Data from a segment using CGH-explorer.35 The examples show cases of partial trisomy (left panels) and partial monosomy (right panels). (c) Confirmation of results and refinement of breakpoints by quantitative PCR. X-axis, quantitative PCR amplicon (see Supplementary Table 1 for locations of assays), Y-axis and normalized ratio of case/control signal. Each assay is represented by three points, the case compared with three different control DNAs. (d) Histogram of the distribution of all normalized case/control DNA ratios, total ≈16 000 data points.

