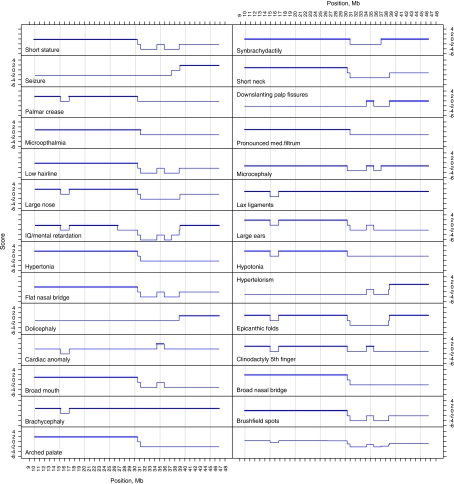
Figure 4.
Genotype–phenotype mapping in partial monosomy 21. Each graph represents one aspect of the phenotype (Table 3). The X-axis represents the position along HSA21q in Mb; Y-axis is the phenotype score for each BAC, with the maximal region shown in bold.

