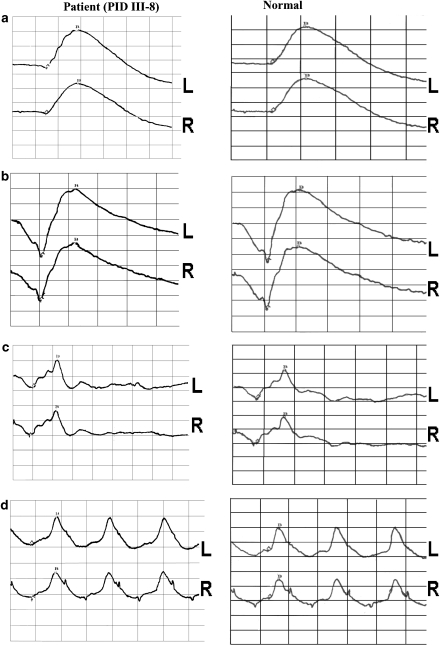
Figure 3.
Electroretinograms (ERGs) from individual PID III-8 (pedigree given in Figure 5) located on the left. ERGs on the right are normal ERG values taken from a patient from a separate study. These tests included (a) Seotopic Blue (b) Scotopic White (c) Photopic White (d) Flicker stimuli.

