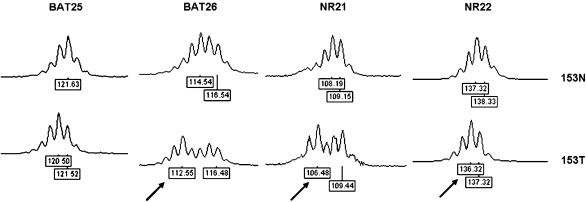
Figure 2.
MSI analysis with quasimonomorphic mononucleotide markers in normal (153N) and tumor (153T) DNA from patient 153. All markers shown are unstable in tumor DNA, as demonstrated by the presence of different profiles in tumor compared to normal DNA. Numbers at the bottom of each electropherogram indicate size (in bp). Arrows in tumor DNA indicate peaks corresponding to allelic sizes not present in a control population.

