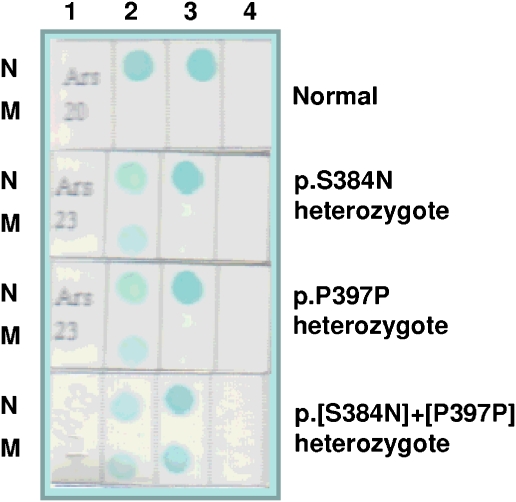
Figure 3.
Reverse dot-blot analysis. Each membrane strip was spotted with the normal (N) and the mutant (M) probe for the p.S384N and the p.P397P gene variants and hybridized to amplified DNA from exon 6 of the gene ARSB. The color was developed with streptavidin-HRP and TMB. The genotype of each individual is shown on the right. A strip with no probe spotted was used as blank. 1=sample; 2=p.S384N; 3=p.P379P; and 4=blank.

