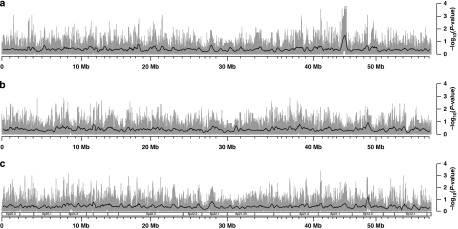
Figure 1.
TD plots for chromosome 6p in the CEU panel. (a) Father specific, (b) mother specific and (c) parent unspecific. The gray bars represent −log10(P-values) of the transmission/disequilibrium tests in each SNP, whereas the smoothing black lines refer to averages of these same results in sliding windows (400 SNPs wide, stepping 10 SNPs after each measurement). Indications for selected cytogenetic bands are given under (c), but apply for all panels.

