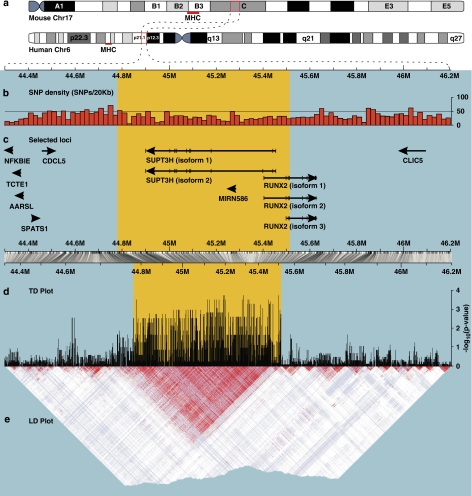
Figure 3.
1.9 Mb region of Hsa6p including the S–M–R region. The region under evidence of TD in CEU fathers (yellow background) comprises 715 SNPs, spanning 730 741 base pairs. (a) Representation of the synteny between mouse Chr17 and human Chr6 with regard to the region between NFKBIE and CLIC5. For reference, the position of the MHC is indicated in both chromosomes with a red bar. (b) SNP density, measured in 20 kb wide bins. (c) Localization of selected loci from the region. The arrows indicate transcriptional orientation, and exons are depicted (only for SUPT3H and RUNX2) through vertical ticks on the lines representing isoforms. (d) Plot of the CEU, father-specific P-values of the transmission/disequilibrium tests. The peak at the left of the picture, around coordinate 44.62M, corresponds to three isolated SNPs that were not considered further. (e) LD plot based on the SNPs from the TD plot, CEU panel. The strong LD spanning the area under the TD peak is evident. Whereas panels b and c are plotted having all base pairs in the region as reference, panels d and e are plotted based only on the HapMap SNPs available for this region. The horizontal bar between panels c and d represents the correspondence between these two different reference systems (scaling). This is why the yellow background is wider above the bar than below it, although it highlights the same genomic region.

