Figure 6.
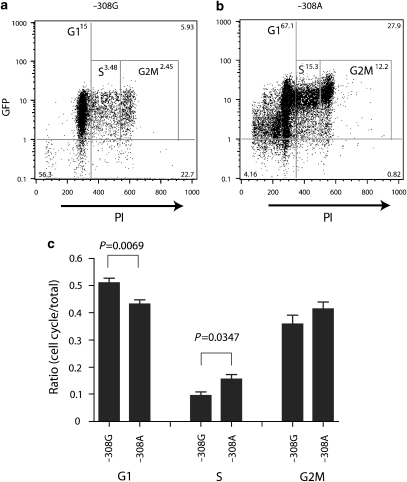
Cell cycle contribution to −308 allelic expression differences in the −308G and −308A FRT-Jurkat reporter cell lines (a and b). Dot plots of GFP fluorescence on y axis vs Propidium Iodide (PI) staining on the x axis to show sub-populations of cells in each phase of the cell cycle. G1, S, and G2M DNA contents are as labeled for each gate, with the percentage of GFP+ cells in each population shown in superscript. Panel a represents cell cycle analysis of the −308G reporter cell line, whereas panel b represents the −308A reporter line. (c) Graphical representation of seven independent cell cycle experiments of the ratio of the mean fluorescence (percentage of GFP+ cells multiplied by the mean channel fluorescence) in each cell cycle phase. Statistical significance was determined by Student's unpaired t-test. P<0.05 was considered significant.

