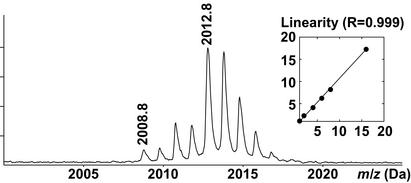
Figure 3.
Linearity assay. To simulate two protein pools with differing extent of phosphorylation, the relative amounts of ovalbumin digested in H218O or H216O was set to 16:1, and a MALDI spectrum was acquired for the T31 phosphopeptide after IMAC selection and elution with alkaline phosphatase. (Inset) The plot of the ratios of the theoretical vs. the experimentally measured areas of the T31 (2,008.8 Da) and the 18O-labeled T31 (2,012.8 Da).

