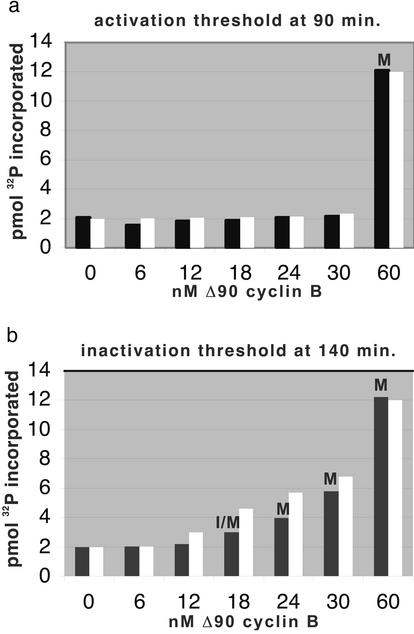
Figure 3.
The amplitude of the down jump in Cdc2 activity is less than that of the up jump. Samples from cycling extracts prepared as in Fig. 2 were analyzed for Cdc2 kinase activity as measured by incorporation of 32P from [γ-32P]ATP into histone H1. (a) Activation threshold as in Fig. 2a. (b) Inactivation threshold as in Fig. 2b. Experimental data (black bars) are compared with numerical simulations of the Novak–Tyson model (white bars). Extracts are labeled M when >90% nuclei on a slide appear mitotic (condensed chromatin, no nuclear envelope). In extract labeled I/M (b), 58% nuclei were in mitosis.

