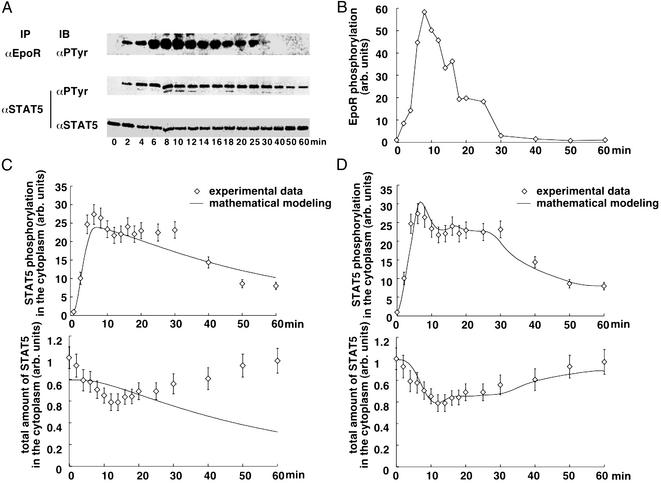
Fig 2.
Time course (points with error bars) and mathematical modeling (solid lines) of the STAT5 nucleocytoplasmic cycle. (A) Transient activation of EpoR and STAT5. Starved BaF3-EpoR cells were left unstimulated (0) or were stimulated with 5 units/ml Epo for the time indicated. Cytoplasmic extracts were subjected to immunoprecipitation (IP) with anti-EpoR and anti-STAT5 antiserum, and were analyzed by immunoblotting (IB) with the antiphosphotyrosine (PTyr) antibody or reprobed with anti-STAT5 antiserum, followed by enhanced chemiluminescence and detection using a LumiImager. The LumiImager files are displayed. (B) Linear interpolation of EpoR tyrosine phosphorylation as input function for the four-dimensional differential equation. The time course of EpoR tyrosine phosphorylation in response to Epo stimulation was quantified with LUMIANALYST software and is displayed in arbitrary units. C and D show for the cytoplasmic tyrosine phosphorylated STAT5 and the total STAT5 pool in the cytoplasm the measured data in arbitrary units and the corresponding fit obtained with the linear model (C) and the model including nucleocytoplasmic cycling (D).

