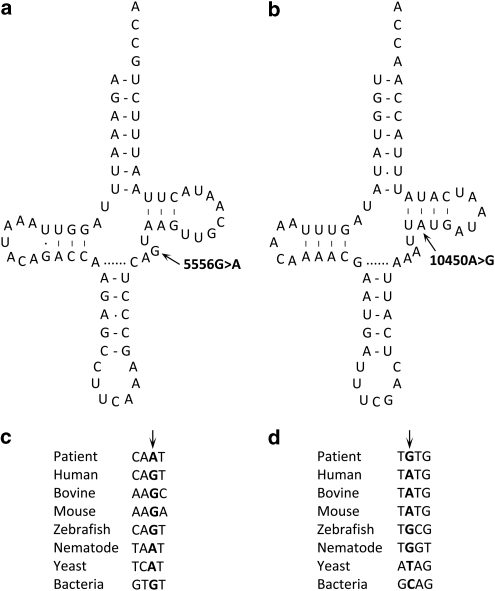
Figure 1.
Schematic representation of the tRNATrp (a) and tRNAArg (b) cloverleaf structures, showing the location of the mutations. Comparison of the sequences of the variable region of the tRNATrp gene (c) and the T-stem of the tRNAArg gene (d) across different species; the mutated bases are depicted in bold.

