Figure 4.
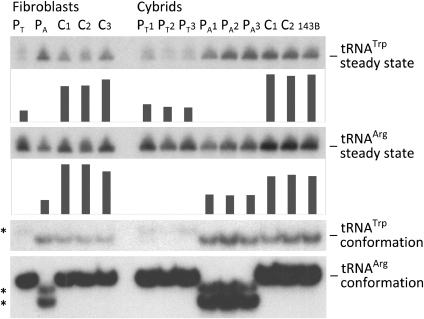
Steady-state levels and conformation of tRNATrp and tRNAArg. Fibroblasts and cybrid clones from patient T (PT) and A (PA) and controls (C1–3 and 143B) were analyzed using high-resolution northern blot under denaturing (steady-state) and native (conformation) conditions. Signal intensities for tRNATrp and tRNAArg were normalized to each other for each sample, as shown in the column charts (only relevant steady-state levels are depicted). The asterisks indicate the position of altered conformations of mutant tRNATrp and mutant tRNAArg.

