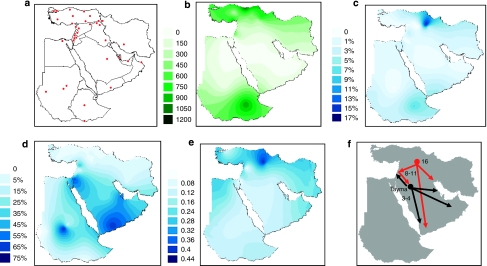
Figure 1.
(a) Red symbols indicate the geographical locations of 36 populations analyzed. (b) Interpolated spatial contours of annual precipitation (mm) distribution. (c) Interpolated J1* frequency spatial distribution. (d) Interpolated J1e frequency spatial distribution. (e) Interpolated J1e mean haplotype variance spatial distribution. (f) Construed trajectories of J1e lineage spread episodes. In red are delineated the initial Holocene migrations from the Taurus/Zagros Mountains to the Arabian Peninsula. Shown with black arrows are the subsequent expansions of Arabic populations in Arabia beginning in the Bronze Age.

