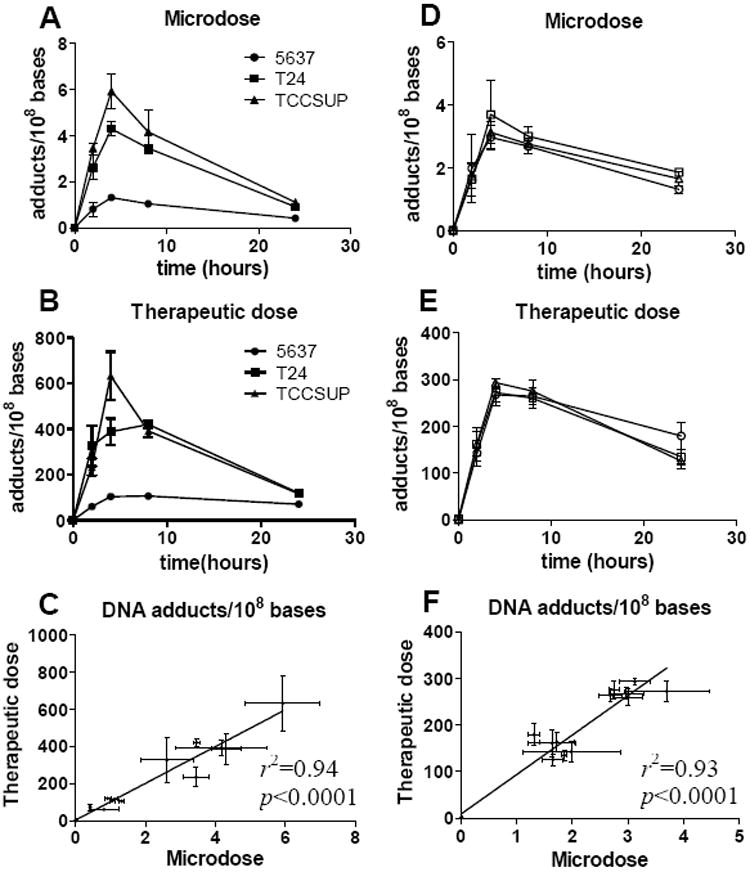
Figure 2. Carboplatin-DNA monoadducts induced by [14C]carboplatin without or with gemcitabine.

A and B: The levels of carboplatin-DNA monoadducts in three bladder cancer cell lines 5637, T24 and TCCSUP cells. C. Linear regression analysis of the DNA adduct data from A and B. The concentration of carboplatin-DNA monoadducts formed by [14C]carboplatin microdoses are linearly proportional to those caused by therapeutic carboplatin. D and E: The levels of carboplatin-DNA monoadducts as a result of gemcitabine exposure at 0.3, 3 and 30 μM, are represented by squares, circles and triangles, respectively, as the mean ± s.d.. Cells were exposed to gemcitabine for 4 h followed by carboplatin exposure at 1 μM (D), or 100 μM for 4 hours (E). F. Linear regression analysis of the data from D and E. The concentration of carboplatin-DNA monoadducts formed by [14C]carboplatin microdoses are linearly proportional to those caused by therapeutic carboplatin, regardless of gemcitabine exposure
