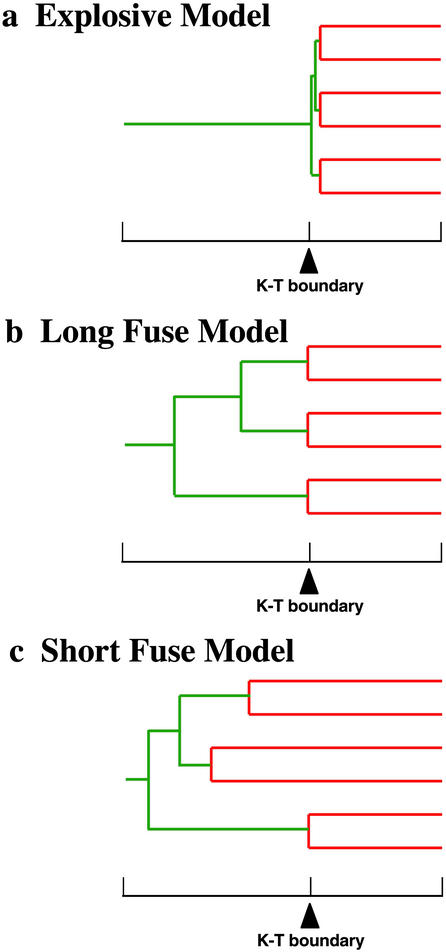
Figure 1.
Simplified versions of three models (1) for the timing and diversification of placental mammals. Red branches indicate intraordinal diversification; green branches indicate interordinal divergences. A simplified time scale is shown below each tree, with an arrow marking the K/T boundary.

