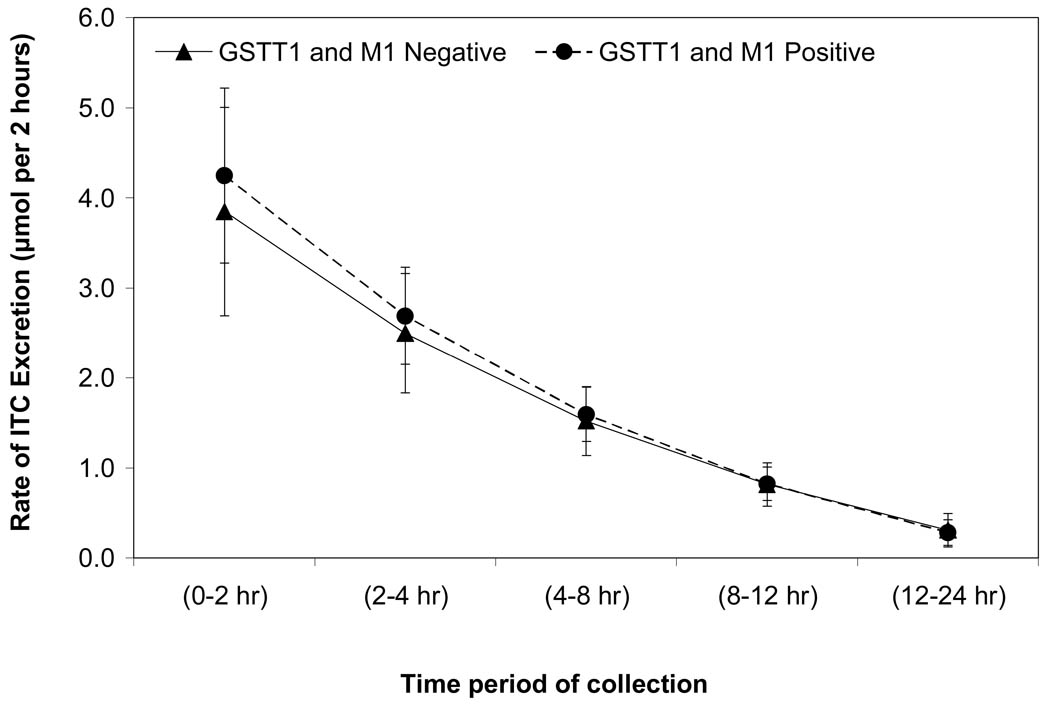
Figure 2.
Fitted mean total ITC (and 95% CI) excreted in the urine for GSTT1 and M1 positive and null subjects with an ITC concentration of 72 µM estimated with a linear mixed model. The model was fit to the log-transformed total ITC values to meet modeling assumptions, however, the fitted means presented here have been back-transformed and are on the original scale. The final model included fixed effects for GST status, time, their interaction, juice content, and random effects for the intercept and slope.

