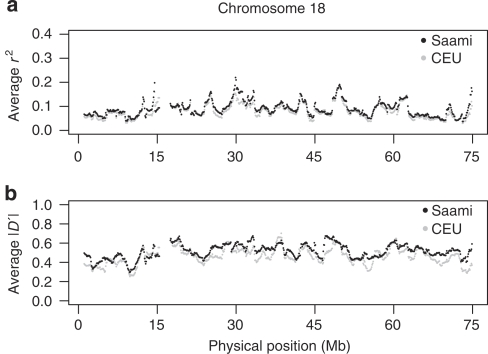
Figure 3.
Comparison between the extent of LD on chromosome 18 in CEU and the Saami. The averages of the LD measures r2 (a) and ∣D′∣ (b) were calculated for all SNPs within 500 kb from each other in sliding windows of 1.7 Mb (1.6-Mb overlap between adjacent windows). Patterns of LD in the CHB+JPT panel were very similar to those in the CEU panel (not shown). Averages were almost consistently higher in the Saami as compared with that in the CEU and CHB+JPT panels. This was most pronounced for ∣D′∣. This same observation was made for all chromosomes (not shown).

