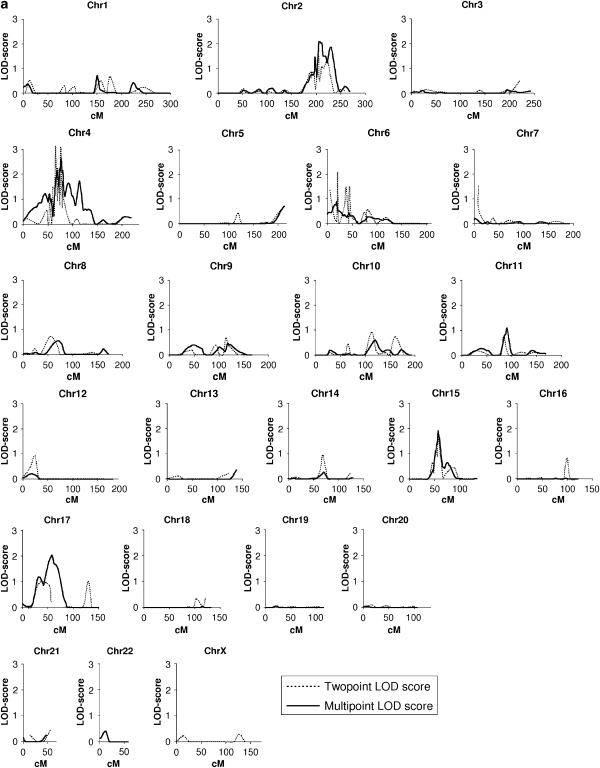
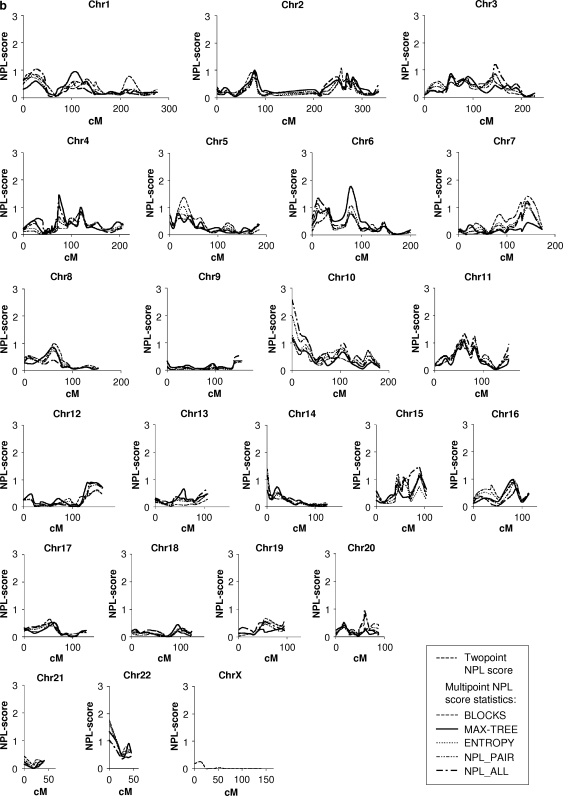
Figure 1.
(a) Results of the genome-wide quantitative analysis. All genotyped markers were included in the analysis. The x axis indicates the distance (cM) from the p-terminus and the y axis indicates the LOD score. Chr, chromosome. (b) Results of the genome-wide qualitative analysis. All the statistics calculated before adding markers to the regions with LOD score ⩾1.5 are presented in the figure. The x axis indicates the distance (cM) from the p-terminus and the y axis indicates the NPL score. Chr, chromosome.


