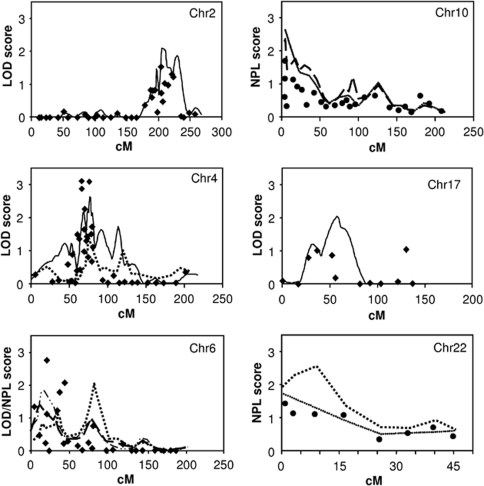
Figure 2.
Results showing suggestive evidence of linkage (LOD/NPL score ⩾2.0) in the case of six chromosomes in quantitative analysis (HDL-C as a continuous variable, age and sex as covariates) or in qualitative analysis (subjects having their measured HDL-C levels in the lowest 10th percentile for the general population were coded as affected). Only the results of the MAX-TREE statistics (most powerful at detecting linkage to a dominant trait) or NPL_ALL scores (most powerful at detecting linkage to an additive trait) are reported here for the qualitative analysis, but the results of the other statistics were consistent with these assessments. The x axis indicates the distance (cM) from the first genotyped marker and the y axis indicates the LOD/NPL score. Chr, chromosome.  , quantitative multipoint analysis;
  , qualitative multipoint analysis, NPL_ALL
 ; The same analysis in the initial scan (no additional markers);
  qualitative multipoint analysis, MAX-TREE;
  , qualitative multipoint analysis with overweight (BMI>25) subjects with low HDL-C coded as affected, NPL-ALL;
  , quantitative two-point analysis with sex, age and BMI (for Chr6) as covariates;
  , qualitative two-point analysis.

