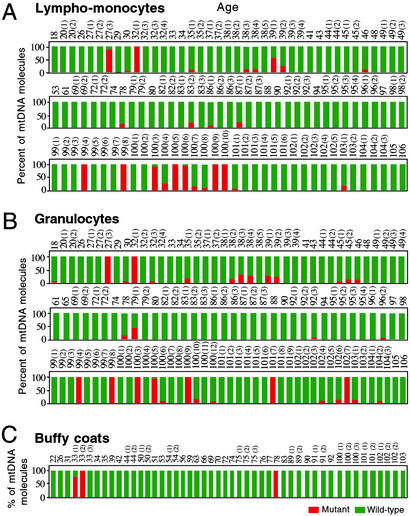
Figure 2.
Bar graph summarizing the age distribution and frequency of the C150T transition (as determined by primer extension analysis) in mtDNA from lympho-monocytes (A), granulocytes (B), and buffy coats (C) of differently aged individuals. The number above each bar indicates the age in years of the individual analyzed. Red bars, C150T mutation-carrying mtDNA; green bars, wild-type mtDNA.

