
Figure 2.
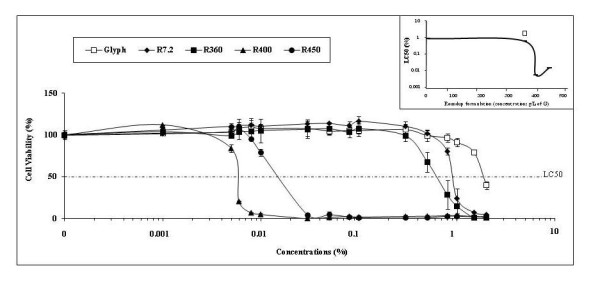
Dose-dependent effects of Glyphosate and different Roundup formulations on HepG2 viability. The formulations were applied during 24 h without serum (even for G) in 48-well plates, after reaching 80% confluence with serum-containing medium. These effects and the formulations with G concentrations (7.2 to 450 g/l) indicated with symbols were evaluated as described in Fig. 1. All experiments were repeated 4 times in triplicates. The curve in frame summarizes the nonlinear dose effects of R formulations on HepG2. The LC50 (%) values are compared for the 4 R and G (in similar conditions) as a function of G concentrations in the formulations. The LC50 for G alone is indicated by the empty square above the curve.