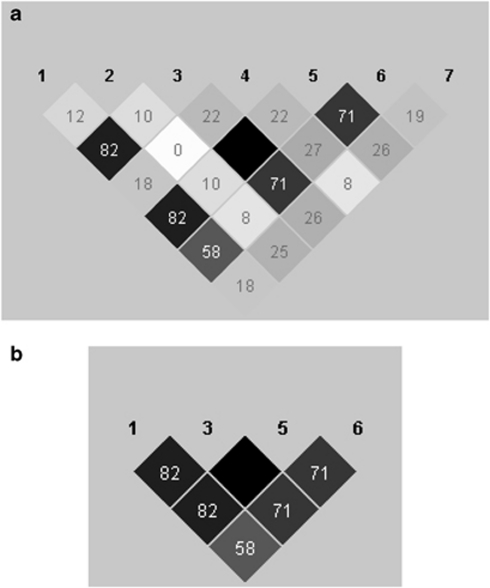
Figure 1.
Schematic of the r2blocks algorithm. HAPLOVIEW plot of pairwise r2 values between a set of seven simulated SNPs; the block shading shows the strength of correlation. (a) Assuming a window size (M) of 4 and an r2 threshold of 0.70, the r2blocks algorithm begins with the highest pairwise LD value, here between SNPs 3 and 5, which are in perfect LD (r2=1.0). Starting with SNP 3, consider r2 values with SNPs 1, 2 and 4. Only SNP 1 passes the r2 threshold; add SNP 1 to the block. Discontinue growing the block to the left. Consider r2 values between SNP 5 and SNPs 4, 6 and 7 and add SNP 6. Move to SNP 6, consider r2 values between SNP 6 and 7, which is below the threshold. Terminate growing block to the right, creating block 1 of SNPs 1, 3, 5 and 6. Now consider r2 values between SNPs not assigned to blocks: SNPs 2, 4 and 7; none of the pairwise r2 values are above the threshold, hence the algorithm terminates, leaving these three SNPs as singletons. (b) The resulting haplotype block from (a).

