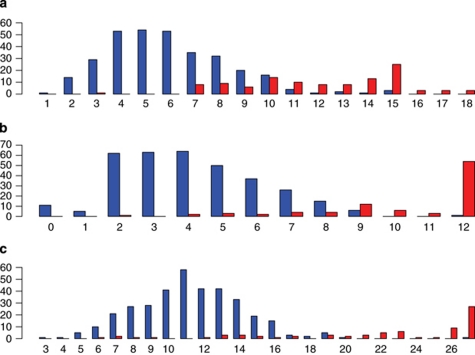
Figure 3.
Histograms of the number of minor allele carriers at associated SNPs by HLA allele carrier status. (a) HLA-A*01 (18 SNPs), (b) HLA-A*03 (12 SNPs), (c) HLA-B*08 (27 SNPs); y-axis = frequency, x-axis = number of SNPs in which individuals carry at least one minor allele. Blue = HLA allele noncarrier; red = HLA allele carrier.

