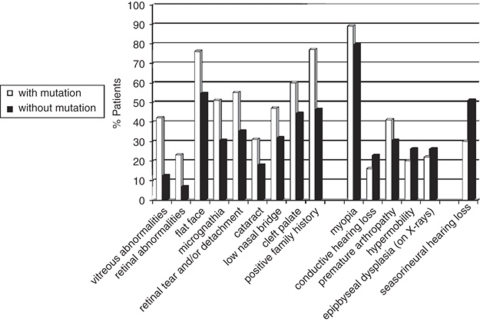
Figure 1.
Frequency of clinical and radiographic characteristics in patients with a COL2A1 mutation (white bars) and patients without a COL2A1 mutation (black bars). From left to right: the first nine characteristics have a P-value ≤0.05, the next five characteristics are not statistically significant and the remaining characteristic (sensorineural hearing loss) shows reverse significance with P-value <0.005.

