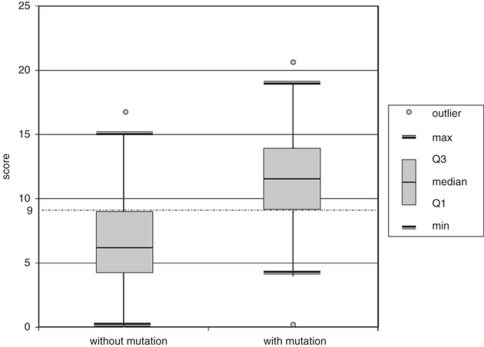
Figure 4.
Box plot presentation of the total scores in both patient groups with Q1 representing the first quartile or 25th centile and Q3 representing the third quartile or 75th centile. Max indicates the maximum score, and min the minimum score, that is not an outlier or that is within 1.5 times the interquartile range (Q1–Q3). Overall, 75% of the patients with a COL2A1 mutation had a total score ≥9.

