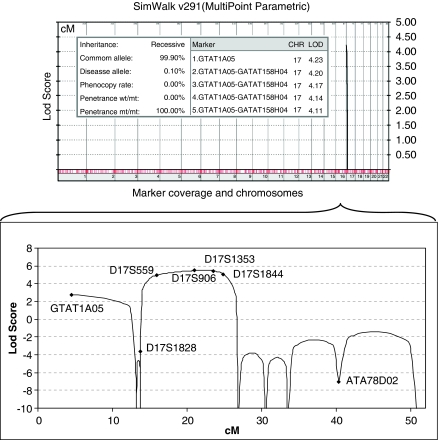
Figure 3.
Multipoint lod scores of the total data set generated by the genome scan in a recessive model with full penetrance. Only lod scores >0 are plotted, in the order of chromosomal position. Top five scores are given within the graph. Multipoint lod score graph at the 17.21-Mb region on chromosome 17p13.3–p11.2 including markers used in fine mapping is enlarged in the lower panel.

