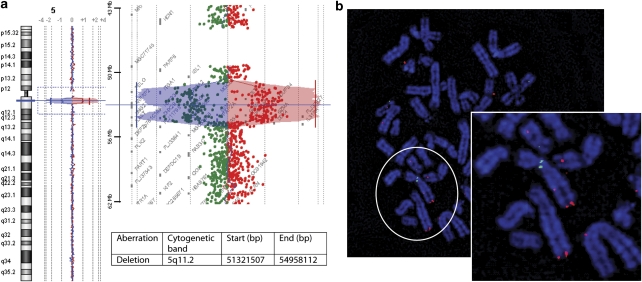
Figure 1.
Visualization and confirmation of deletion 5q11.2. (a) 5q11.2 deletion visualized with Agilent CGH analytics software (version 3.3.28); deviation from 0 on a log2 scale, experiment performed in duplicate. The maximum deleted region ranged from 51 079 864 to 55 001 348 Mb (NCBI Build 36.1). The minimum deleted region ranged from 51 321 507 to 54 958 112 Mb. (b) FISH to a metaphase spread, showing the absence of a green fluorescent signal (BAC RP11–160F8) at 5q11.2 on one chromosome 5. The red signal (BAC RP11-11K19; control probe) is present on both chromosomes on the 5q subtelomeric regions.

