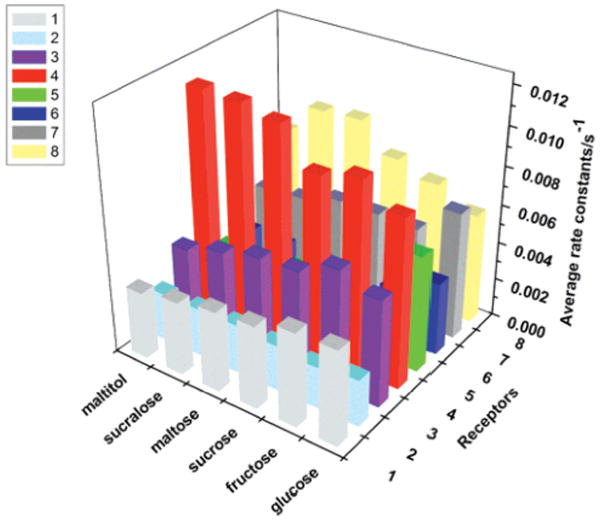
Figure 5.
Pattern-based saccharide sensing plot. Rate constants are used to assess the responses of each of eight semi-selective receptors with six sugars and sugar adducts. Each saccharide concentration was set to 80 μM in 500 μM HEPES buffer at pH=7.4. The blank resin beads were exposed first to the saccharide solution, then to a brief buffer wash, and finally to the indicator solution (8 μM in 500 μM HEPES buffer at pH=7.4. Image used with permission, [26••].

