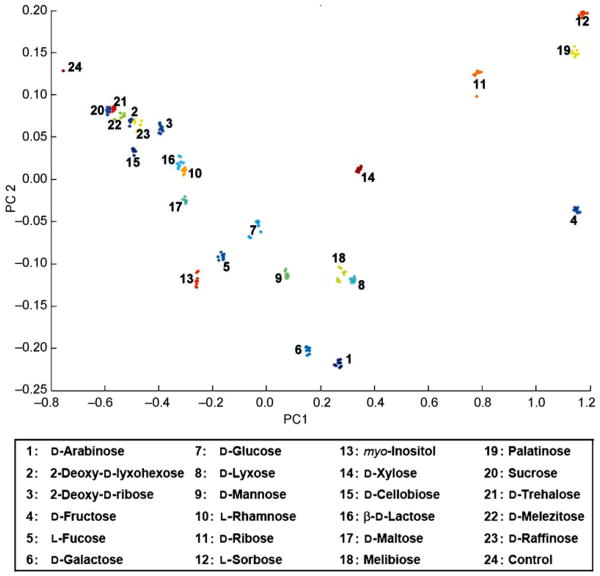
Figure 6.
Principal component analysis (PCA) plot for the identification of 23 carbohydrates at high concentrations (100 mM). Each numbered cluster represents multiple trials for each sugar using 384-well plates of liquid solutions containing one of 12 different pH indicators with one of two boronic acids at non-physiological pH with full spectrophotometric analysis. 98% of discriminatory information was contained within the first two principal components. Cluster plot was designed by combining two sets of data, one for each boronic acid system at a pH optimal to the system. Image used with permission, [34•].

