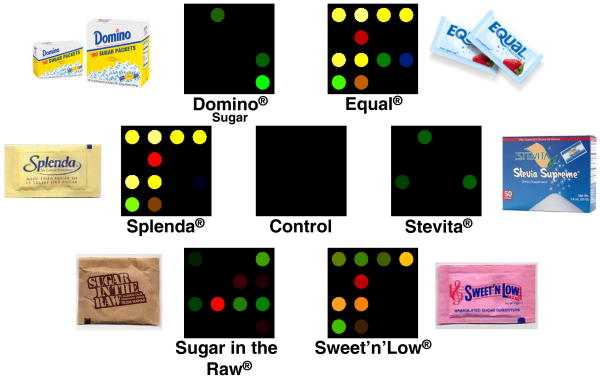
Figure 8.
Color difference maps for six commonly used natural and artificial sweetener packets and one control. One packet of each analyte was dissolved in 4 oz. of weakly buffered 5 mM, 3-nitrophenylboronic acid solution (pH 7.45) and scanned for 5 min after exposure. The color range is expanded from 3 bits to 8 bits per color (RGB range of 3-10 expanded to 0-255). Image used with permission, [25•].

