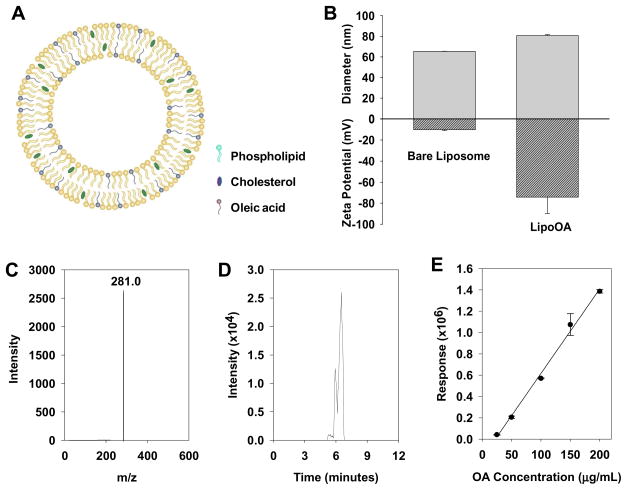
Fig. 1.
Characterization of oleic acid-loaded liposomes (LipoOA). (A) Schematic structure of LipoOA consisting of phospholipid, cholesterol and OA. (B) Hydrodynamic size (diameter, nm) and surface zeta potential (mV) of LipoOA and bare liposomes (without OA) measured by dynamic light scattering (DLS). (C–E) Quantification of OA encapsulation efficiency in LipoOA by liquid chromatography-mass spectrometry (LC/MS). (C) Mass spectrum of OA. (D) LC/MS chromatogram of OA. (E) Corresponding linear calibration standard curve of OA measured by LC/MS. Data represents mean ± SD of three individual experiments.

