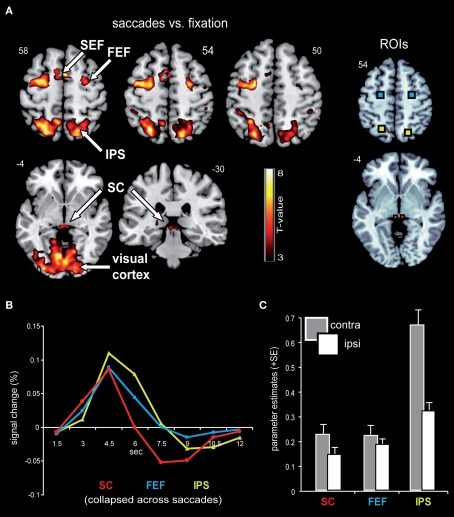
Figure 3.
Saccade-related BOLD activity. (A) Saccade trials, as compared to fixation trials, were associated with robust activity in a broad network that included bilateral IPS, FEF, SEF, SC, as well as large parts of the visual cortex. This contrast was based on an HRF that has been optimized for subcortical activity, with a peak at 4.5 s. Activity is displayed on a standard T1-weighted image (display cut-off T = 3; extent threshold k = 15). (B) Mean BOLD time courses for the selected ROIs, namely the SC (depicted in red), FEF (blue), and IPS (yellow) are displayed averaged across all saccade trials and both hemispheres. (C) The collapsed ROI-based parameter estimates (beta) for leftward and rightward saccades with respect to the hemisphere contra- and ipsilateral to saccade direction revealed a relative activity enhancement in the contralateral (gray bars) as compared to the ipsilateral (white bars) hemisphere within SC, FEF, and IPS.

