
Figure 8.
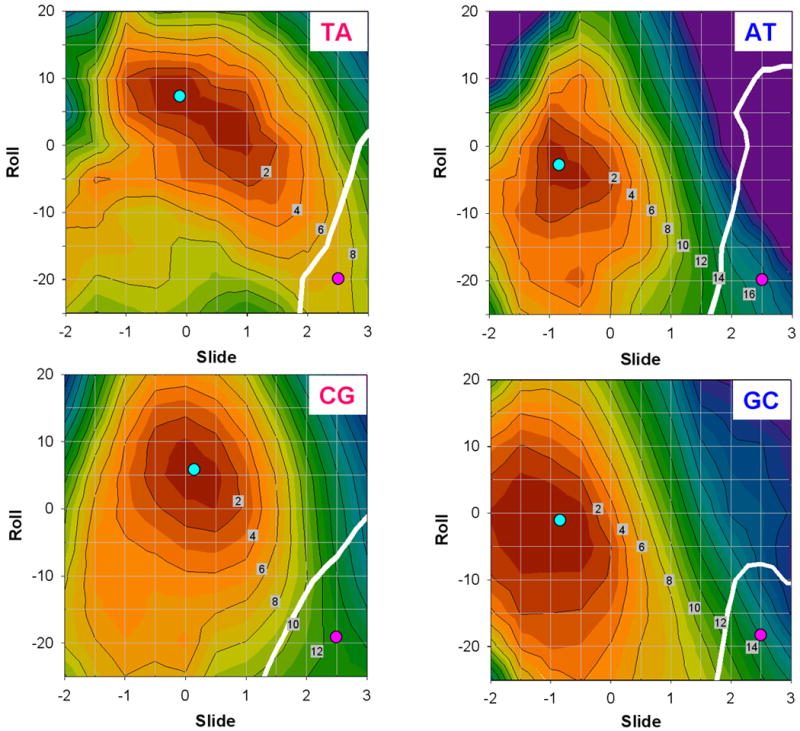
Two-dimensional (Roll versus Slide) energy contour plots for hexamers with the YR and RY central steps. The hexamer sequences are the same as in Figure 7. The contour line separation is 2 kcal/mol. Cyan circles: the optimal structures. Pink circles: the Kink-and-Slide deformed structures. White thick lines: the boundary between BI and BII forms, i.e. structures with equal backbone dihedral angles ε and ζ.