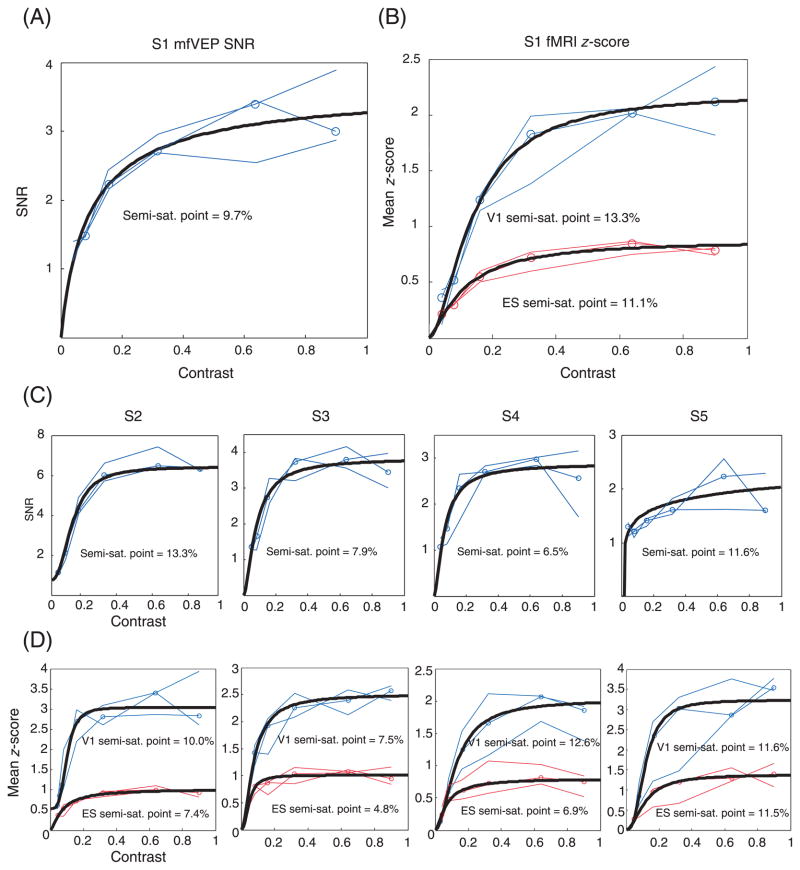
Figure 5.
(A) The mfVEP contrast response functions for one subject (S1). Thin blue lines indicate the results from 3 different days. Open symbols show the median values of 3 days. Thick black curve shows the 3t of Equation 1. (B) The BOLD data of fMRI scanning from the same subject as in A. Thin lines indicate the mean z-scores in V1 area (blue) and ES area (red) from 3 different days. Open symbols show the median values of 3 days. Thick black curve shows the 3t of Equation 1. (C) (D) The mfVEP and fMRI data from the other 4 subjects.

