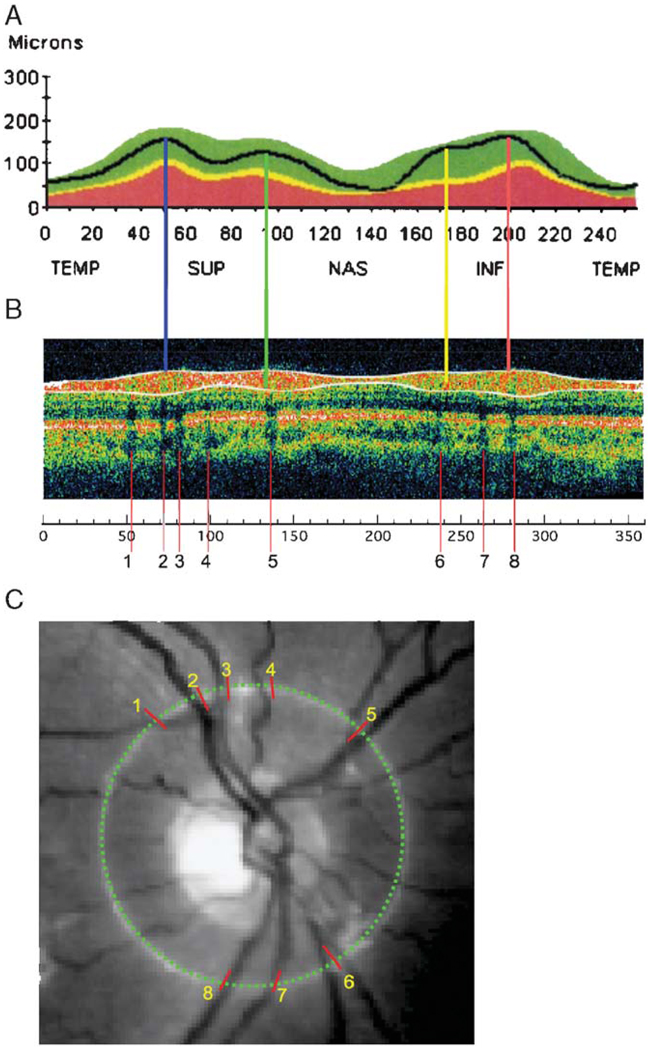
FIGURE 1.
The RNFL profile (A), scan density (B), and fundus image (C) from the OCT RNFL report of a commercial instrument. The colored vertical lines in (A) mark the location of the local maxima of the RNFL profile. The shadows in (B) are marked with vertical red lines. The locations of these red lines were measured on the scale in (B) and these locations were transferred to the image in (C) using a protractor.

