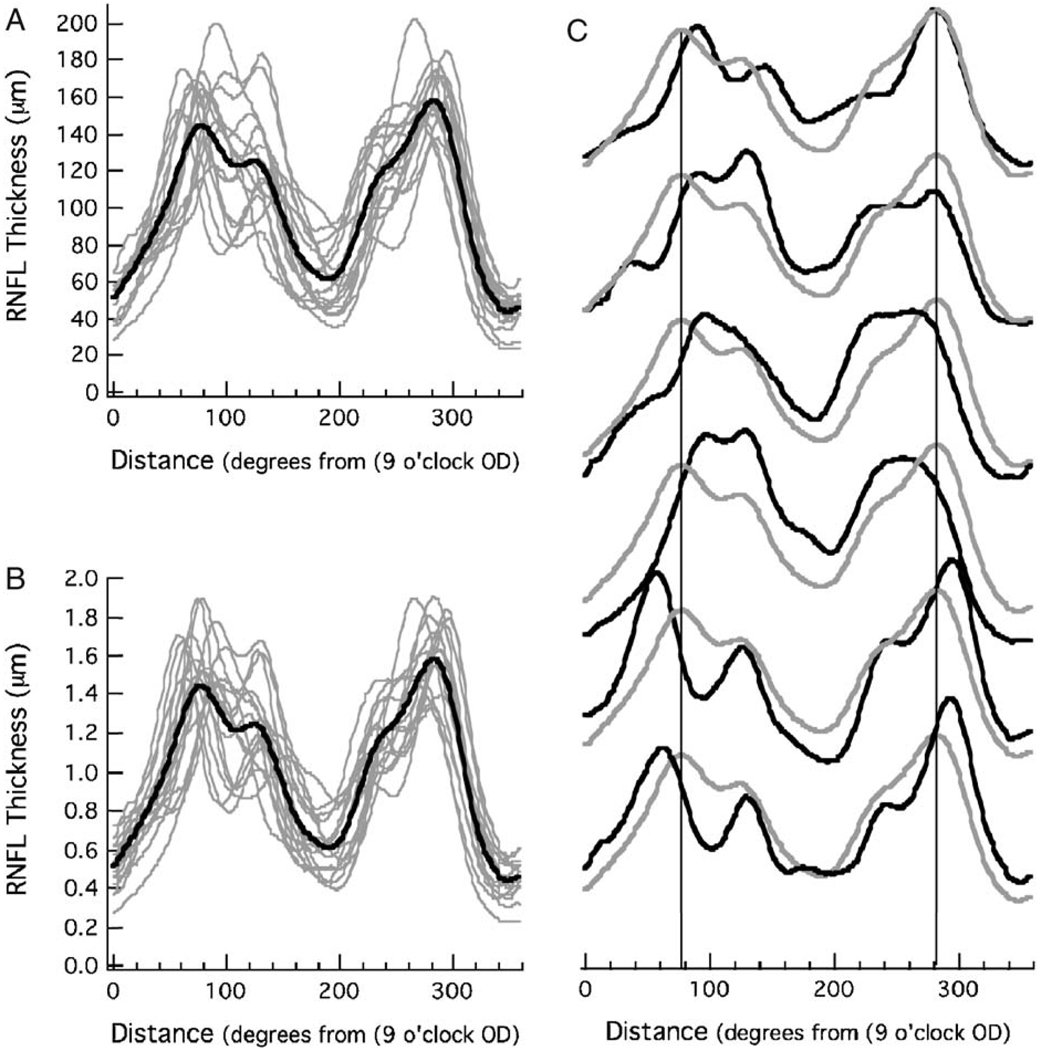
FIGURE 4.
A, The OCT RNFL thickness profiles from 16 controls (gray) with the mean of these 16 profiles (black). B, The RNFL profiles in (A) normalized by dividing each by its mean RNFL thickness. C, The OCT RNFL profiles from the 6 controls (black) with the largest R2 values with the mean of all 16 control profiles (gray).

