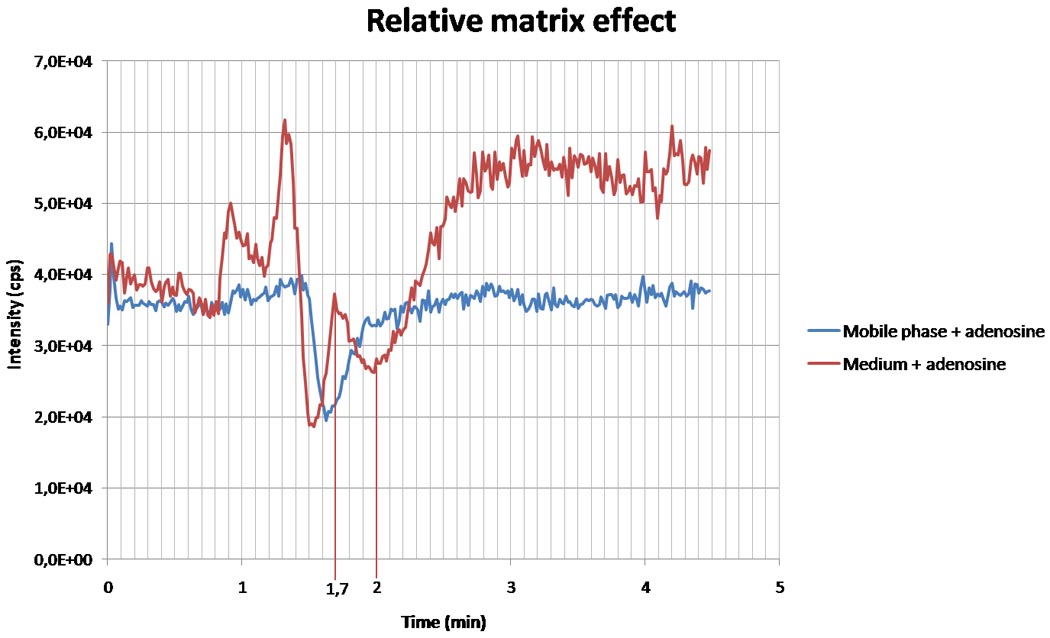
Figure 3.

relative matrix effect measured via continuous injection of adenosine (1000 ng/ml) and mobile phase (blue curve) or medium (red curve). After 1.7 minutes, at the time of the expected adenosine peak, adenosine signal in medium is higher than the adenosine signal in mobile phase, indicating ionization enhancement. Around 2 minutes, when the peak of the internal standard is expected, a decrease in adenosine is found in the medium, but not in the mobile phase, suggestive for ionization suppression.
