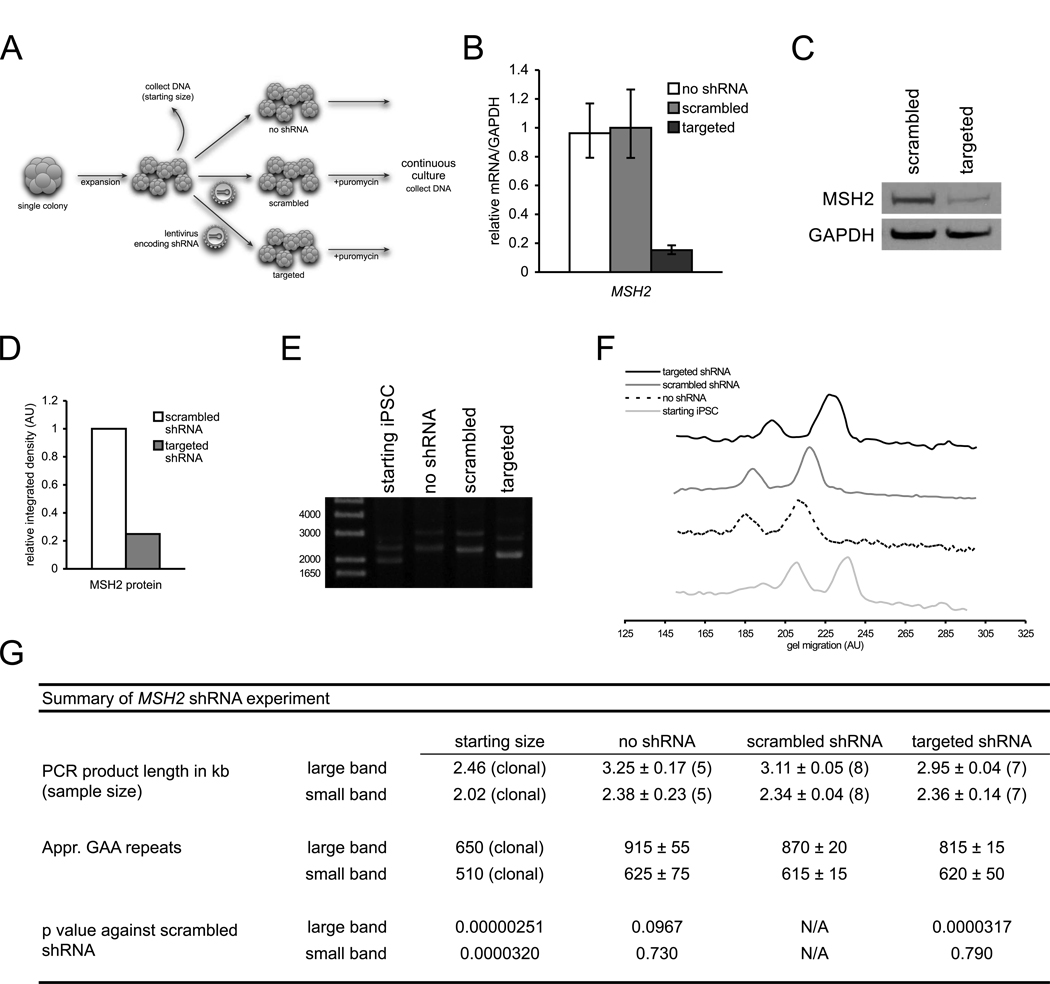
Figure 4. shRNA silencing of MSH2 in FRDA iPSCs.
(A) Diagram of silencing experiment.
(B) MSH2 mRNA levels of targeted and scrambled shRNA-expressing FRDA iPSCs. mRNA levels are normalized to GAPDH. Errors bars = SEM of duplicate measurements.
(C) Western blot of MSH2 protein in FRDA iPSCs with scrambled shRNA and targeted shRNA. GAPDH, loading control.
(D) Densitometric analysis of MSH2 protein normalized to GAPDH of previous panel.
(E) PCR of GAA•TTC repeat lengths pre-silencing (starting iPSC) and eight passages after transduction with no shRNA (no shRNA), scrambled shRNA (scrambled), and shRNA against MSH2 (targeted). Note: data are from single point data and do not represent pooled data (panel G).
(F) Signal intensity traces of ethidium-stained agarose gel from panel E. Higher gel migration represents smaller PCR bands.
(G) Summary of pooled GAA•TTC repeat length data. See Supplemental Experimental Procedures for quantitation of repeat lengths.
See also Figure S2.

