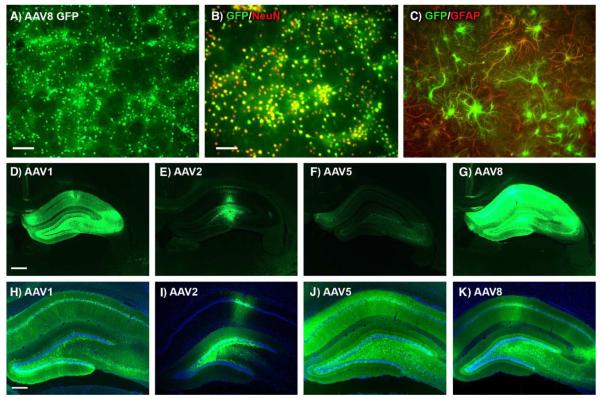
FIG. 1.
AAV8 in cultured cells and AAV1, AAV2, AAV5, and AAV8 in rat hippocampus. (A) GFP epifluorescence in mixed neuron/astroglia culture 5 days after adding AAV8 GFP (1 × 10¹¹ vector genomes per 1 × 10⁵ plated cells). (B) Colocalization of GFP (green) and the neuronal marker NeuN (red) demonstrating efficient neuronal gene transfer. (C) Colocalization of GFP (green) and the astroglial marker GFAP (red) in a microscopic field containing mostly astrocytes. (D) Green fluorescence from AAV1 GFP vector. (E) AAV2 GFP. (F) AAV5 GFP. (G) AAV8 GFP. Equal dose (2 × 10¹⁰ vector genomes), equal expression interval (4 weeks), and equal exposure time for image capture in D–G (1 s) demonstrate relatively robust GFP signal with AAV8. Sections shown in D–G are proximal to the injection track, are the peak sections for each subject shown, and represent the overall trend in relative brightness observed in 10 animals/serotype group. (H–K) Same order of serotypes as D–G with DAPI counterstain and with various exposure times. Bars: A, 160 μm; B, 100 μm; D, 610 μm; H, 305 μm. B and C, D–G, and H–K same magnifications.

