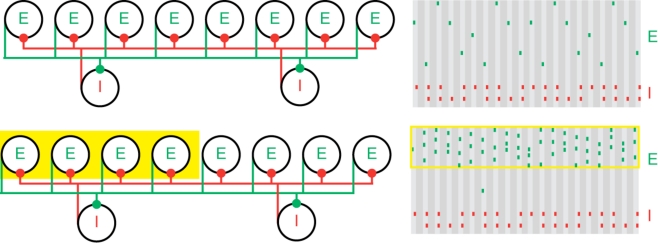
Figure 1.
Population gamma activity and competition among excitatory cells. Upper left: A cartoon representation of two interacting cell populations that generate a persistent gamma rhythm; circles labeled “E” represent pyramidal cells and “I” represent FS cells. The two cell populations are reciprocally connected with excitatory (green) and inhibitory (red) synapses from each cell to all other cells. Upper right: Cartoon example of the spiking activity of the two cell populations during persistent gamma activity. Each tick mark represents an action potential (or spike) of an E (green) or I (red) cell. In each cycle of the persistent gamma rhythm, a single pyramidal cell spikes and delivers excitation to the FS cells. The FS cells then spike and inhibit the pyramidal cells. When the inhibition decays sufficiently, one of the pyramidal cells generates another spike, and the rhythm continues. Lower: Increased depolarizing input to a subset of pyramidal cells (yellow box on the left) increases their spiking activity. The population gamma rhythm continues with the “driven” pyramidal cells (yellow box on the right) dominating the excitatory activity.

