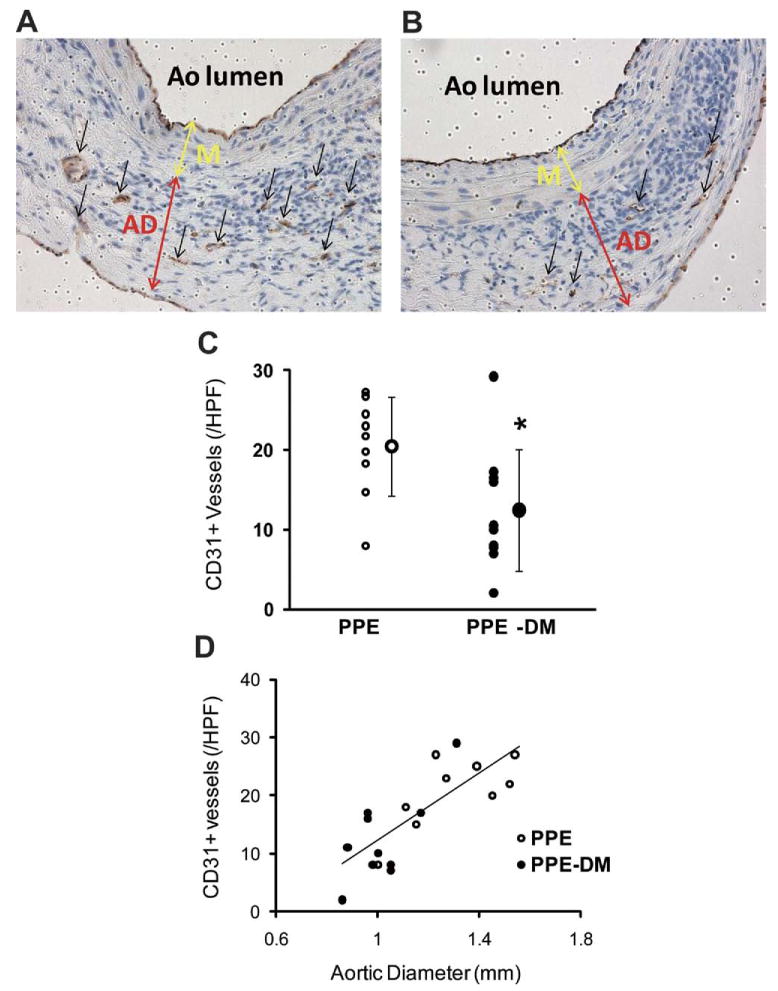
Fig 2.

Representative images of CD31 staining in (A) PPE and (B) PPE-DM (original magnification ×400). AD, adventitia; Ao, aorta; M, media. C, Number of medial and adventitial CD31+ vessels (A and B, black arrows) per high power field (HPF). The range bars show the standard deviation. *P < .0229 vs PPE; small circles represent individual data points, large circle represents mean of cohort. D, Correlation between neovessel density and aortic diameter, γ = 29.68X – 17.86; correlation coefficient, R = 0.794; P < .0001; PPE (n = 9), PPE-DM (n = 10). DM, Diabetes mellitus; PPE, porcine pancreatic elastase.
