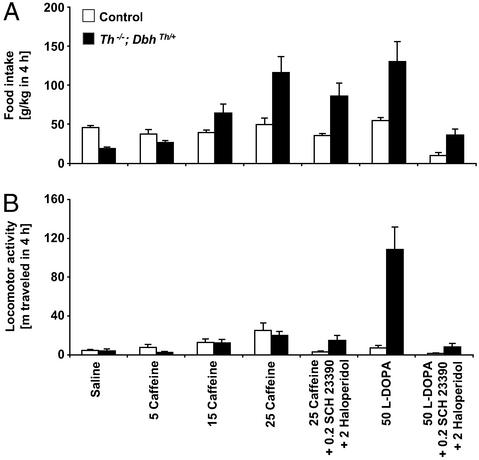
Figure 1.
Caffeine- and l-dopa-induced feeding behavior and locomotor activity over 4 h. (A) Food consumption, g/kg body weight (mean ± SEM). (B) Locomotion is reported as distance traveled in meters. Control mice, white bars (n = 8); Th−/−; DbhTh/+ mice, black bars (n = 8). Numbers indicate dose of drug (mg/kg body weight).

